Teams using Qwairy kept telling us the same thing: the data is there, but acting on it takes too long. Comparing competitors means opening ten tabs. Switching pages resets your filters. And understanding how AI engines cite sources requires paid tools that barely scratch the surface.
v1.15 fixes all three. Competitor Compare lets you pit 2 to 10 competitors against each other across 11 metrics in a single view. Advanced Filters & Saved Lists persist across every page, so you set your context once and navigate freely.
That's the headline, but v1.15 ships 13+ features in total: the GEO Matrix heatmap, MCP integration, Bing Webmaster Tools, shared links with white-label, PNG exports, and more.
Competitor Compare: Head-to-Head Analysis
You know your competitors are mentioned by AI engines. But which ones win on which providers, for which topics, and why? That question used to require hours of manual cross-referencing across dashboard tabs. Competitor Compare answers it in one view.
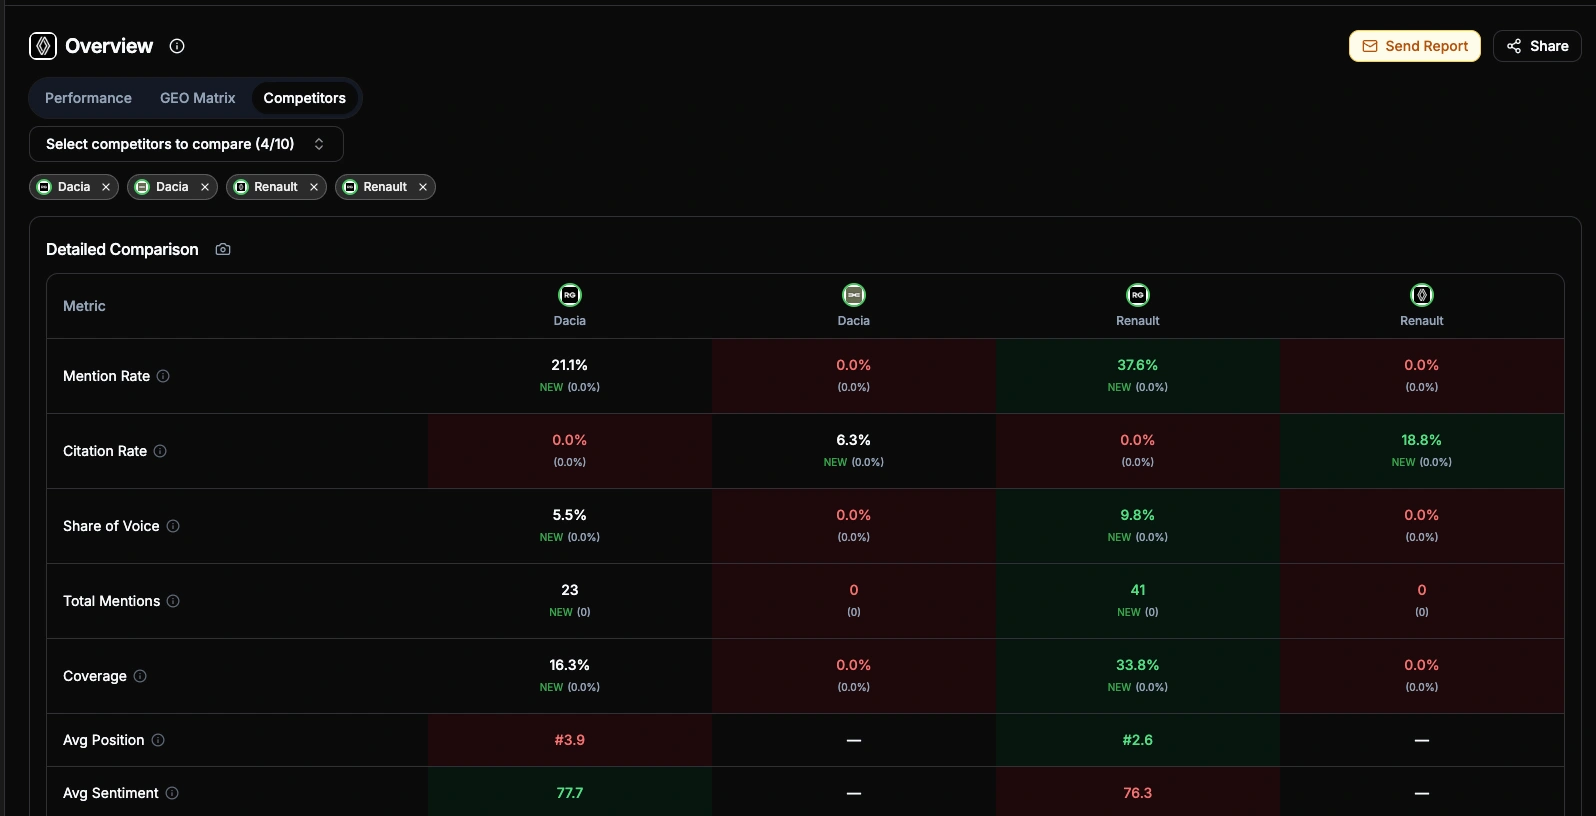
Select 2 to 10 competitors and get five layers of analysis:
11-metric comparison table covering Mention Rate, Citation Rate, Share of Voice, Total Mentions, Coverage, Avg Position, Avg Sentiment, Avg Relevance, Source Citations, Source Pages, and Providers. Green/red highlighting for best/worst, period-over-period trends on every cell
Brand Positioning scatter chart: a quadrant plot with freely configurable X and Y axes — pick any of 11 metrics (Mention Rate, Citation Rate, Share of Voice, Total Mentions, Coverage, Avg Position, Avg Sentiment, Avg Relevance, Source Citations, Source Pages, Providers) for each axis. Quadrant labels and scales adapt dynamically to your selection
Evolution chart to track how competitors move over time across 6 switchable metrics (Mentions, SoV, Coverage, Position, Sentiment, Relevance). Your brand gets a thicker line for easy spotting
Competitor Overlap matrix: an asymmetric co-mention heatmap. Each cell answers "When Brand A is mentioned, how often does Brand B appear in the same AI response?" — and crucially, A→B ≠ B→A. High overlap (green) signals direct competition on the same prompts; low overlap (red) reveals differentiated positioning. Hover any cell to see exact shared/total answer counts. The asymmetry is the insight: if your overlap with a rival is 80% but theirs with you is 20%, they dominate a much larger share of AI conversations independently
Breakdown heatmaps across 5 dimensions: Providers, Topics, Tags, Funnel stages, and Prompts. A metric selector lets you switch between 8 metrics (Mention Rate, Citation Rate, Share of Voice, Total Mentions, Avg Position, Avg Sentiment, Avg Relevance, Source Citations) with best/worst highlighting per row. Rows are sorted by your brand's performance by default, and Prompts include a direct link to the prompt detail page
The payoff: One agency used Compare to show a client that their main competitor had 3x more Source Citations on Perplexity, all from a single comparison article. That insight became their next content brief.
Advanced Filters & Saved Lists: One Filter Bar, Every Page
Every team member looks at different slices of the data: different providers, topics, time ranges. Before v1.15, switching pages meant re-applying filters every time. Not anymore.
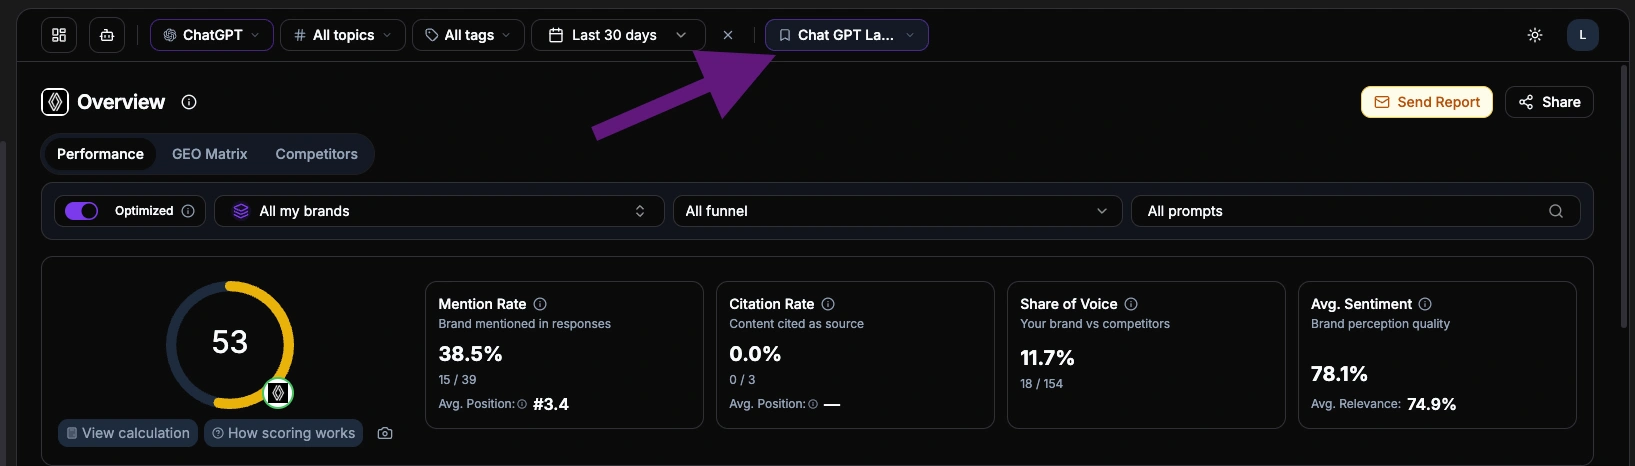
A unified filter bar now sits at the top of every dashboard page. All filters support multi-select, so you can narrow down to exactly the combination you need: three specific providers, two topics, one tag, last 30 days. That selection stays synchronized as you navigate between Visibility, Insights, Strategy, and Performance. No reset, no re-apply.
URL sync: Every filter state is reflected in the URL. Copy it, share it, bookmark it
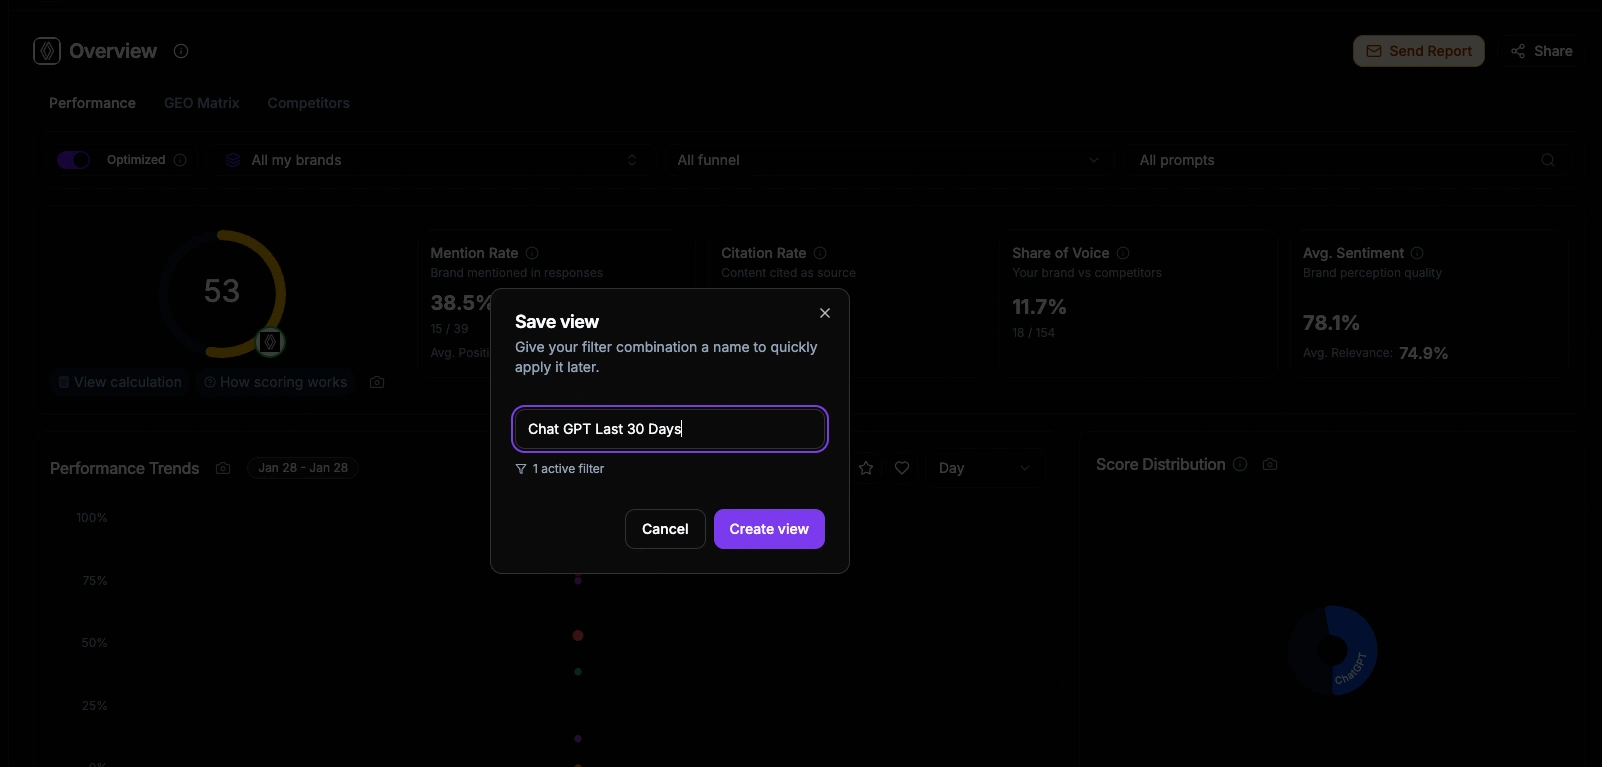
Saved Lists: Name and save any filter combination, then load it with one click. Lists persist across sessions and are visible to your whole workspace
Page-specific additions: Some pages add their own controls on top of global filters. For example, the Performance page adds competitor, funnel stage, and prompt selectors, while the Overview page runs filter-free for an unbiased snapshot
The payoff: A team managing 4 client brands created one saved list per client. Morning reviews went from "open dashboard, set filters, check data, repeat" to "click list, read, next."
GEO Matrix: Your Visibility at a Glance
Dashboards with tables and charts are useful. But when you have 30 topics across 10 providers, you need a faster way to spot what's working and what's not.
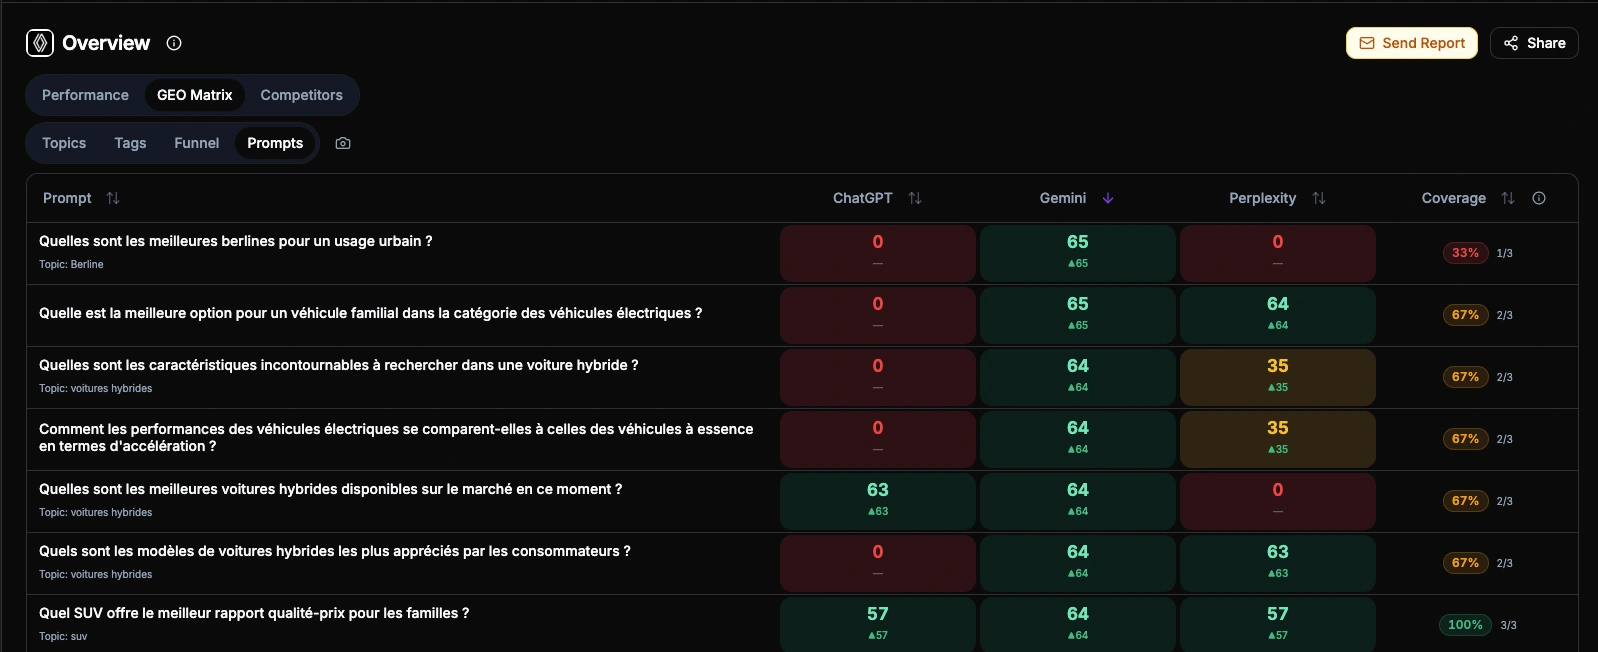
The GEO Matrix is a heatmap that maps your topics against AI providers.
Each cell shows a color-coded score from 0 to 100: green where you're strong, red where you're invisible.
Click any cell to open a detail panel with score breakdown, competitor positions, cited sources, and trend sparklines
Trend indicators on rows and columns show week-over-week movement
Coverage metrics tell you how many providers mention your brand per topic
The insight: One user discovered their brand scored 80+ on ChatGPT and Claude for "enterprise analytics" but 12 on Perplexity, because Perplexity relied on a competitor's comparison page. One content fix closed the gap.
Empfiehlt die KI Ihre Marke oder Ihre Wettbewerber?
Starten Sie ein kostenloses Audit: In wenigen Minuten beantworten ChatGPT, Gemini und Perplexity live 8 Kauffragen zu Ihrem Markt, und Sie sehen, wen sie empfehlen.
Connect Claude Desktop, VS Code Copilot, Cursor, or any MCP-compatible client to your Qwairy data. The server exposes 17 tools covering brands, scores, competitors, sources, and prompts, all secured with OAuth 2.1 and PKCE. Ask "what's my visibility on ChatGPT for enterprise security?" from your IDE and get live data back.
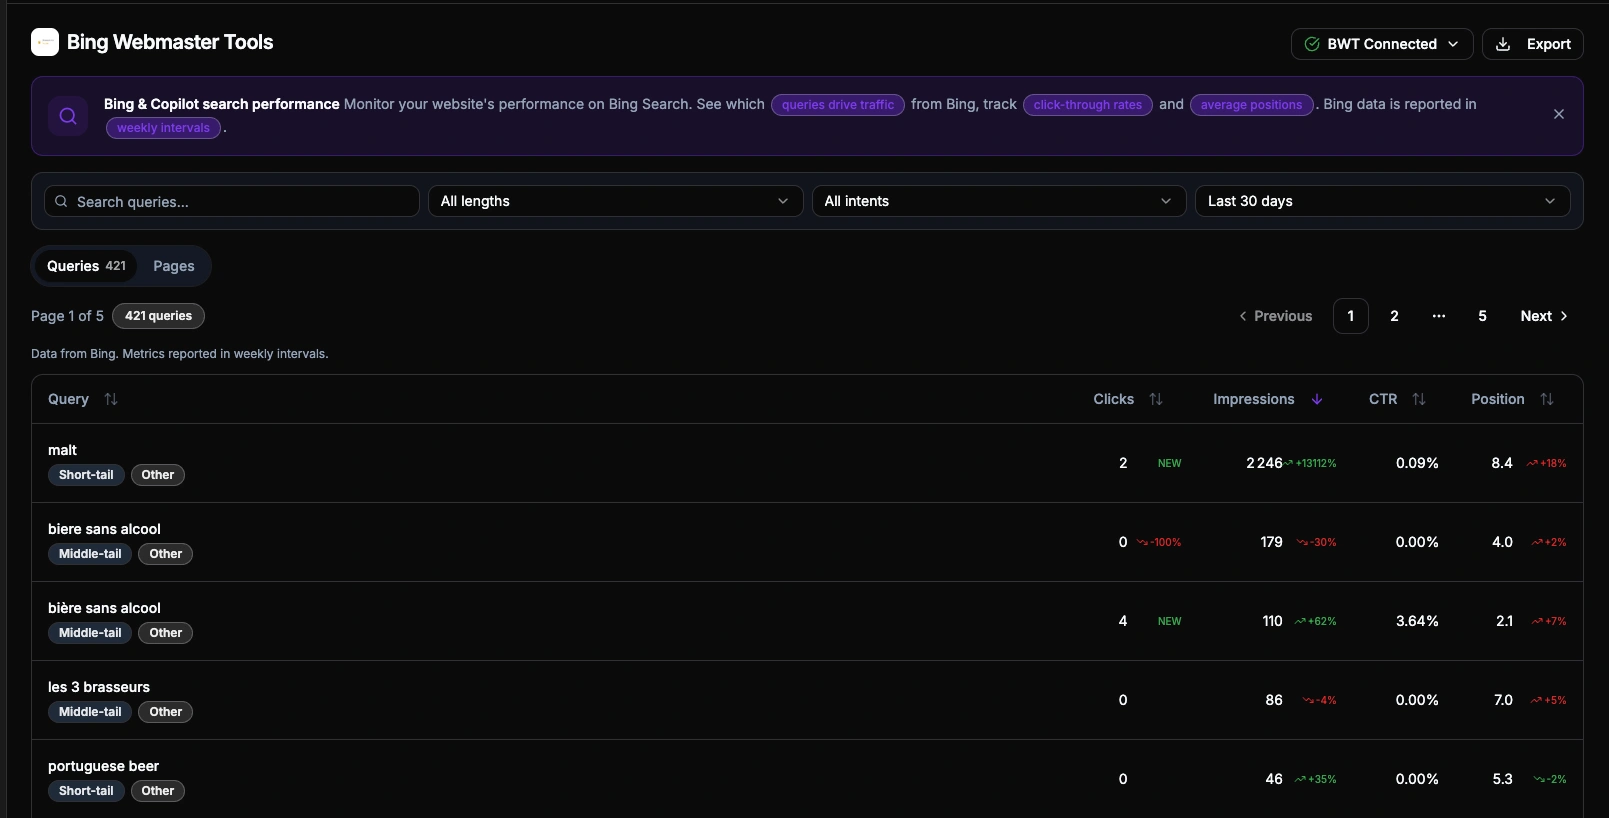
Bing is not just "another search engine." Its index powers Microsoft Copilot and serves as the retrieval layer for ChatGPT's web search. The queries appearing in BWT data reveal what content AI systems are actually pulling from your site, exposing consumer search intentions at their closest point to the AI pipeline.
Connect your Bing API key, pick a verified site, and get queries and pages with clicks, impressions, CTR, and position. Qwairy enriches each query with intent classification (transactional, comparison, question, local) and cross-references it with your existing monitored prompts, so you can spot gaps between what consumers search and what you track.
Exports now run asynchronously in the background. Click "Export" on any page, pick a time range, and both CSV and XLSX files are generated automatically. Track progress in real-time, get an email when ready, and download from the Export Hub for up to 30 days.
All paid plans. Setup: Export Hub (from Workspace Settings)
Enterprise SSO (OIDC)
Configure Okta, Azure AD, Google Workspace, or any OIDC-compliant IdP from Team Settings. Add your company domains, verify via DNS, and team members sign in through your IdP automatically. Just-In-Time provisioning creates new users on first login.
Enterprise plan. Setup: Team > SSO
Also in v1.15
PNG Export: Export any dashboard card as a branded PNG image. Available on 15+ cards including the GEO Matrix, ready for presentations and client reports
Shared Links with White-Label: Generate public share links for any dashboard view. Share pages display your team's logo for a branded experience. Available for GEO Matrix, Competitors, and filtered views
Competitor Detail Redesign: The competitor detail page is now organized into 4 tabs: Overview (stats and proximity analysis), Evolution (daily metrics with trend charts), Sources (cited domains and pages), and Mentions (paginated table)
Source Detail Cockpit: Rebuilt source detail page with a cockpit layout for faster navigation between source metrics
Overview Page Redesign: New 3-tab layout with a dedicated Funnel tab and intent distribution breakdown
Competitor Favorites & Ignored: Star competitors to prioritize them across all selectors and auto-select them in Compare. Ignore irrelevant competitors to exclude them from scores
Looker Studio v2 Connector: Updated connector for Google Looker Studio with multi-select filters and new evolution endpoints
API v1 Improvements: Multi-select filters, new evolution endpoints, Prompt Evolution, and role-based access control for API consumers
Customizable Tag Colors: Assign custom colors to tags for easier visual identification across the dashboard
Onboarding Checklist & Guided Tours: A step-by-step widget for new users, plus interactive guided tours with popover walkthroughs
Performance: Faster matrix rendering, cursor-based pagination across sources and competitors, optimized filter state management, and reduced API payloads
Bei welchen Fragen erscheinen Ihre Wettbewerber, Sie aber nicht?
Content Opportunities listet die Themen, bei denen die KI Ihre Wettbewerber erwähnt, Ihre Marke aber nicht, jeweils mit Impact-Score.
FAQWhat is the GEO Matrix in Qwairy?
The GEO Matrix is a heatmap that maps your topics against AI providers, showing color-coded visibility scores from 0 to 100. Switch between Topics, Tags, Funnel, and Prompts views, and click any cell to see a detailed breakdown with competitors, sources, and trend sparklines.
What is the MCP Server integration?
The MCP (Model Context Protocol) Server exposes 17 tools via OAuth 2.1 with PKCE, letting you connect Qwairy data to Claude Desktop, VS Code Copilot, Cursor, and other MCP-compatible AI tools. Available on Growth plan and above.
How do Advanced Filters and Saved Lists work?
A unified filter bar (Providers, Topics, Tags, Period) appears on every dashboard page. Filters persist across navigation and sync to the URL for easy sharing. You can save filter combinations as named lists with specific providers, topics, tags, and time periods. Lists are stored in your workspace, and the active list is automatically detected when you reload the page. The Performance page combines these global filters with its own page-specific controls for competitor, funnel stage, and prompt.
What is the Export Hub?
The Export Hub is a centralized page to manage all your data exports. Exports run asynchronously in the background, generating both CSV and XLSX files automatically. You can select a time period (7d, 30d, 90d, all time, or custom range), track export progress in real-time, download completed files, and receive an email notification when your export is ready. Files are available for 30 days.
What changed in the competitor detail page?
The competitor detail page is now organized into 4 tabs: Overview (stats and proximity analysis), Evolution (daily metrics charts with trend indicators), Sources (source domains and top pages), and Mentions (paginated mentions table). Tab state is stored in the URL for easy sharing.
How does competitor comparison work?
The Compare tab on the Overview page lets you select 2 to 10 competitors and get five layers of analysis. A detailed comparison table with 11 metrics including Source Citations, Citation Rate, and Source Pages. A brand positioning scatter chart with freely configurable X and Y axes across 11 metrics. An asymmetric competitor overlap matrix that shows, for each pair, how often one brand appears when the other is mentioned in AI responses — revealing who competes head-to-head and who occupies a different niche. An evolution line chart with 6 switchable metrics and per-competitor toggles. A breakdown card with 5 tabs (Providers, Topics, Tags, Funnel, Prompts) and 8 switchable metrics, sorted by your brand performance by default.
How does Enterprise SSO work?
Enterprise teams can configure OIDC Single Sign-On from Team > SSO. Add your Identity Provider details (Okta, Azure AD, Google Workspace, etc.), verify your company domains via DNS TXT record, and team members will be redirected to your IdP on login. New users are automatically provisioned with the role you define.
Verfolgen Sie Ihre KI-Sichtbarkeit
Was erzählt die KI Ihren Käufern über Sie, und wen empfiehlt sie stattdessen?
Verfolgen Sie die Fragen, die für Ihr Geschäft zählen, sehen Sie, welche Marken jede Antwort erwähnt und welche Quellen sie zitiert, und arbeiten Sie an den Lücken.